The central source of power in the digital world today is the network effects stemming from the control of data. A network effect is defined as something whose value to all participants increases as more people participate in a particular platform or → network. There are many examples, from the telephone system, to social media, to marketplaces, where many independent parts (e.g., devices, people, organisations) interact with each other and constitute a large complex system.
When network effects result from the links within data then these are called “data-network effects”. [1] These occur when a service becomes smarter as it gets more data from its users. Digital platforms record their users’ activities, link to one another to build giant data-networks, and compute them with machine-learning algorithms. The more data users contribute, the smarter the service becomes as the users’ data are analysed to make predictions, recommendations, and performance improvements, as well as improve interfaces and so on. Examples range from Google’s search result optimisations, to Amazon’s product recommendations, to Facebook’s friend suggestions, to Uber’s pooling of taxi riders. Over time, users become increasingly addicted to these services because of the personalisations and improvements that have been made based on their own data. These new means of production through capturing, predicting, and monetising people’s behavioural surplus generate exponential growth and monopoly power for these platforms.
The power of monopolies leads to problems ranging from the threat of censorship to algorithmic biases in the curation of content, to manipulation of people’s behaviour. A recent report from MIT Center for Civic Media notes these platforms that host and inform our networked public sphere are unelected, unaccountable, and often impossible to audit or oversee. [2] Needless to say, none of these digital platforms are public, but instead private digital spaces that are designed to feel like public ones. Furthermore, the report examines alternative platforms which seek to confront these power imbalances. These include open source and federated social media applications, such as Diaspora and Mastodon, as well as peer-to-peer distributed systems based on blockchain technologies. Hence, the report concludes that there is no straightforward technical solution to the problem of platform monopolies.
The reality is that most people do not want to run their own web servers or social network nodes. They want to engage with the web through user-friendlier platforms, and these will be constrained by the same forces that drive consolidation today.
Another fundamental issue with platform monopolies is data ownership, when we take the → labour point of view. [3] Data ownership is usually discussed in the framework of data interoperability, that users are locked in these platforms because they cannot take their social network or data traces with them if they want to migrate to another service. Although demand for data portability points to an important problem, the value of a user’s data in such platforms often remains opaque to them. [4] The spectacle users create on those platforms (through creating social content and meta-content) is not a by-product of use, but the product itself, as mentioned in Tiziana Terranova’s seminal essay “Free Labor: Producing Culture for the Digital Economy”. [5] Moreover, as these platforms expand their reach to everyday life and become part of the surveillance apparatus, this situation can have serious consequences for people’s personal and professional lives. Shoshana Zuboff explains such exploitation of people’s behavioural surplus as a parasitic form of profit, and calls it “surveillance capitalism”:
This is how in our own lifetimes we observe capitalism shifting under our gaze: once profits from products and services, then profits from speculation, and now profits from surveillance. [6]
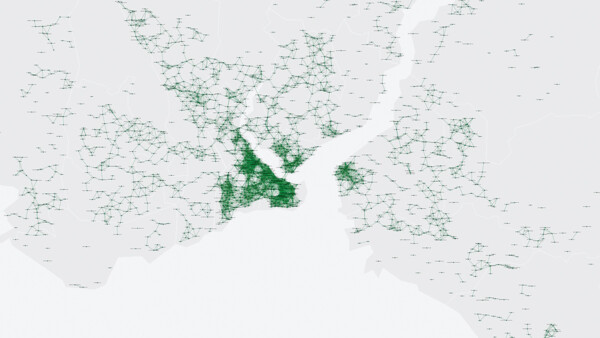
Figure 1: Burak Arıkan: Network of Mosques, Istanbul Design Biennale, 2012.
With the new version of the Internet Protocol (IP), any device in the world can be assigned a unique address for identification and location tracking. This technical preparation for the so-called Internet of Things [7] makes increasingly critical the question of who owns and controls data infrastructures. Do you own a self-driving car’s sensor data captured from your neighbourhood? Are you in control of a nanoengineered drug’s data captured from your body? Are you paid rent for the use of sensor data captured from your home? As our behaviour is systematically forecasted, we have gradually entered a “society of control” that monitors, simulates and pre-mediates individual identities in relation to their data trails. Data oligarchies holding such power will only continue to grow, and the dispossession of our data will increasingly constitute what I call data asymmetries, until we move from connectivity to collectivity, build new purposeful exploitation-free autonomous zones, and reroute our life activities in → solidarity [→ solidarity, → solidarity] with each other. (Figure 1)
Graph Commons (graphcommons.com) is a collaborative platform for mapping, analysing and publishing data-networks. It empowers people and organisations to transform their data into interactive maps and untangle complex relations that impact them and their communities.
Graph Commons members have been using the platform for investigative journalism, creative research, strategising, organisational analysis, activism, archival exploration, and art curating.
![]()
Figure 2: Burak Arıkan, Graph Commons workshop at Transmediale, 4 – 5 February 2016, Berlin. Courtesy of the artist.
Using Graph Commons, activists in Brazil have mapped public-private partnerships causing ecological damage in the Amazon rainforest. (Figure 2) Journalists in Turkey have mapped the network of NGOs aiding Syrian refugees. An art foundation in New York maintains an open graph about their grantee network. A Zurich-based NGO monitors → lobbying influences in the Swiss parliament. These are some of the examples of the many data projects, created in a variety of languages, and on a variety of topics, by people and organisations around the world using the Graph Commons platform.
Graph Commons is an open platform where you can discover content in variety of ways. You can view featured graphs on the homepage; search for people, organisations, and concepts that → interest you; view data (node) profiles and explore relations and graphs. Members have profile pages where you can view their published graphs, their work in progress, and what they recommend on the platform.
Organisations with extensive data needs, such as art institutions, museums, think tanks, civil society organisations, media journalism groups, or specialised projects, use a hub on Graph Commons. A hub is an organisation’s data portal, where you can search and explore their curated graph database.
Mapping your data: Visual Editor, Import, Customisation, Collaboration, Analysis
On Graph Commons, you can collectively compile data about the topics you are interested in, define and categorise relations, transform your data into interactive network maps, discover new patterns, and share your insights about complex issues using a simple interface. The platform serves both producers and consumers of graphs by linking entities together in useful ways and thereby creating a whole that is greater than the sum of its parts.
Using the visual graph editor you can easily brainstorm ideas, working in → collaboration with your colleagues. Besides the visual graph editor, you can also import your existing data sheets. Once you import your data, you apply network analysis to discover patterns, indirect relations, and organic clusters that are otherwise hidden. As you work with your data, you can create unified data taxonomies, customise the colours and icons of the actors and relations in your data, and so develop an effective visual language.
Publishing data: Prints, Embeds, Stories, Comments
Once you’ve prepared your graphs, you publish them on the Internet with a unique permanent link, or permalink. You can share a particular selection from a larger graph, which will also have sharable permalinks with ready-made social media cards. Furthermore, you can embed the interactive graph into your website or online article. Public graphs are licensed to their authors with Creative Commons International 4.0, which applies the license to the author’s graph data structure and its contents (if copyrightable). All graphs have a comment side bar where visitors can leave comments, provide feedback, and discuss your work.
Using these platform features, Graph Commons members collectively experiment in the act of network mapping as an ongoing practice: search across variety of graphs, explore data-networks at scale, invite collaborators to join their work and ask others to contribute. We believe everybody will find a unique way to use Graph Commons in their own connected world.